OpenTelemetry Basics
I got to work on integrating OpenTelemetry in an application that our team maintains recently so I'm starting a series documenting my learnings throughout this journey.
A little background info on the application I'm working on: it's a Slack chatbot written in Typescript using BoltJS. Our goal is to know how many users are using our Slack bot with a breakdown of the percentage of successful and error interactions. When an error happened, we also want to know what exactly the user did and the current state of the application that caused it to error. Based on my reading, the last sentence is exactly what observability promises, So that's why we're giving it a try.
OpenTelemetry can be divided into three categories: tracing, logging, and metrics; but I'll be focusing on tracing in this series.
Tracing Primers
To get started you should know some basic concepts about tracing.
Traces, Spans
A trace consists of multiple spans and a span is a unit of work with a start and end time. In a span, you can create events that marks when something happened in the lifetime of the span.
A span can also have nested spans and these are called child spans. The parent span is usually representing some abstract unit of work, like the lifetime of a HTTP request when it from when it hits the application until the response is sent. Child spans can be used to get more details into the operations done during the lifetime of that parent span ie. API call to another service to fetch more informations.
Span attributes, Status, Errors
To add context to the spans, you can set custom attributes. Ideally, you want to send all the information that will help when debugging your application in the future so that later you don't have to modify the code and add more attribute when you noticed an issue and realized that you don't have enough information to debug the issue.
If your application encounters an error, you can set the span status to ERROR and also add the stack trace to the context for use in debugging. By default your span status will be set to OK.
Span Exporter
After the span ends, you'll want to send it to a backend service that will store and process it so that you can use it later. The sending is done by OTel Exporters. There are multiple backend available that accepts OTel traces as inputs but such as Jaeger, Zipkin but for my testing I'm using Honeycomb with the OLTP Collector.
Debugging
For debugging, there's also the ConsoleSpanExporter which will print out your spans in the console instead of sending it anywhere. I find this very useful to get fast response on what is being sent over but it's hard to do analysis with it so in production environment you should configure the exporter to use other backends instead.
Automatic vs Manual Instrumentation
Now we got the basics out of the way, let's look at how you can start adding spans to your application to build traces.
The easiest way to get started is to use auto instrumentation which will automatically injects code in the HTTP,
requests, DNS, libraries that you're using to create spans and events. In nodejs, this can be done by installing the auto-instrumentations-node NPM package. This package pulls in several other packages to automatically instrument your application.
This is a nice onboarding experience but I get overwhelmed by the amount of data sent when by these auto instrumentation package. Therefore, I recommend to you to start with manual instrumentation instead.
With manual instrumentation, you're forced to be intentional with the data that you're sending to the backend. With this I get to decide which information I want to send over and already have in mind what I want to do with it and which information I would like to gain from it.
Initialization
Whatever approach you end up with for the instrumentation, you'll want to make sure that you're initializing the OTel libraries at the start of your application. This is required because if you starts it later, your application might already be handling request when your OTel libraries are not initialized yet, causing it to miss some requests, or worse encounter errors.
The recommended way to do it is to use the -r flag from the node command:
-r, --require module Preload the specified module at startup. Follows
require()'s module resolution rules. module may be either a path to a file, or a Node.js module name.
So in your package.json you'll have to add that to your start command:
scripts: {
    "start": "node -r ./tracing.js app.js",
}
If you're using Typescript like me, you'll want to use the NODE_OPTIONS shell variable to specify the flag instead:
scripts: {
    "start": "NODE_OPTIONS='-r ./tracing.js' ts-node app.ts",
}
NodeSDK vs NodeTracerProvider Confusion
One thing that made me confused is how different the code for initializing auto instrumentation compared to manual instrumentation.
This is the code provided by Honeycomb to use auto instrumentation. The key there is the getNodeAutoInstrumentation() function which will register all the supported auto instrumentation libraries. One more thing is that it is using the NodeSDK class.
// tracing.js
("use strict");

const { NodeSDK } = require("@opentelemetry/sdk-node");
const { getNodeAutoInstrumentations } = require("@opentelemetry/auto-instrumentations-node");
const { OTLPTraceExporter } = require("@opentelemetry/exporter-trace-otlp-proto");

// The Trace Exporter exports the data to Honeycomb and uses
// the environment variables for endpoint, service name, and API Key.
const traceExporter = new OTLPTraceExporter();

const sdk = new NodeSDK({
    traceExporter,
    instrumentations: [getNodeAutoInstrumentations()]
});

sdk.start()
On the other hand, this is the code example from opentelemetry.io to start manual instrumentation. Notice that it's not using the NodeSDK class anymore and you need to create the Resource and NodeTracerProvider objects and configure it yourself.
const opentelemetry = require("@opentelemetry/api");
const { Resource } = require("@opentelemetry/resources");
const { SemanticResourceAttributes } = require("@opentelemetry/semantic-conventions");
const { NodeTracerProvider } = require("@opentelemetry/sdk-trace-node");
const { registerInstrumentations } = require("@opentelemetry/instrumentation");
const { ConsoleSpanExporter, BatchSpanProcessor } = require("@opentelemetry/sdk-trace-base");

// Optionally register automatic instrumentation libraries
registerInstrumentations({
  instrumentations: [],
});

const resource =
  Resource.default().merge(
    new Resource({
      [SemanticResourceAttributes.SERVICE_NAME]: "service-name-here",
      [SemanticResourceAttributes.SERVICE_VERSION]: "0.1.0",
    })
  );

const provider = new NodeTracerProvider({
    resource: resource,
});
const exporter = new ConsoleSpanExporter();
const processor = new BatchSpanProcessor(exporter);
provider.addSpanProcessor(processor);

provider.register();
TBH I'm still not clear what is the difference betwen using NodeSDK vs manually configuring the NodeTracerProvider. When using NodeSDK does the NodeTracerProvider got configured automatically?
How and when to start tracing?
To start manually instrumenting your application, you'll have to create a root span. A root span is the first span you create once the request enters your application.
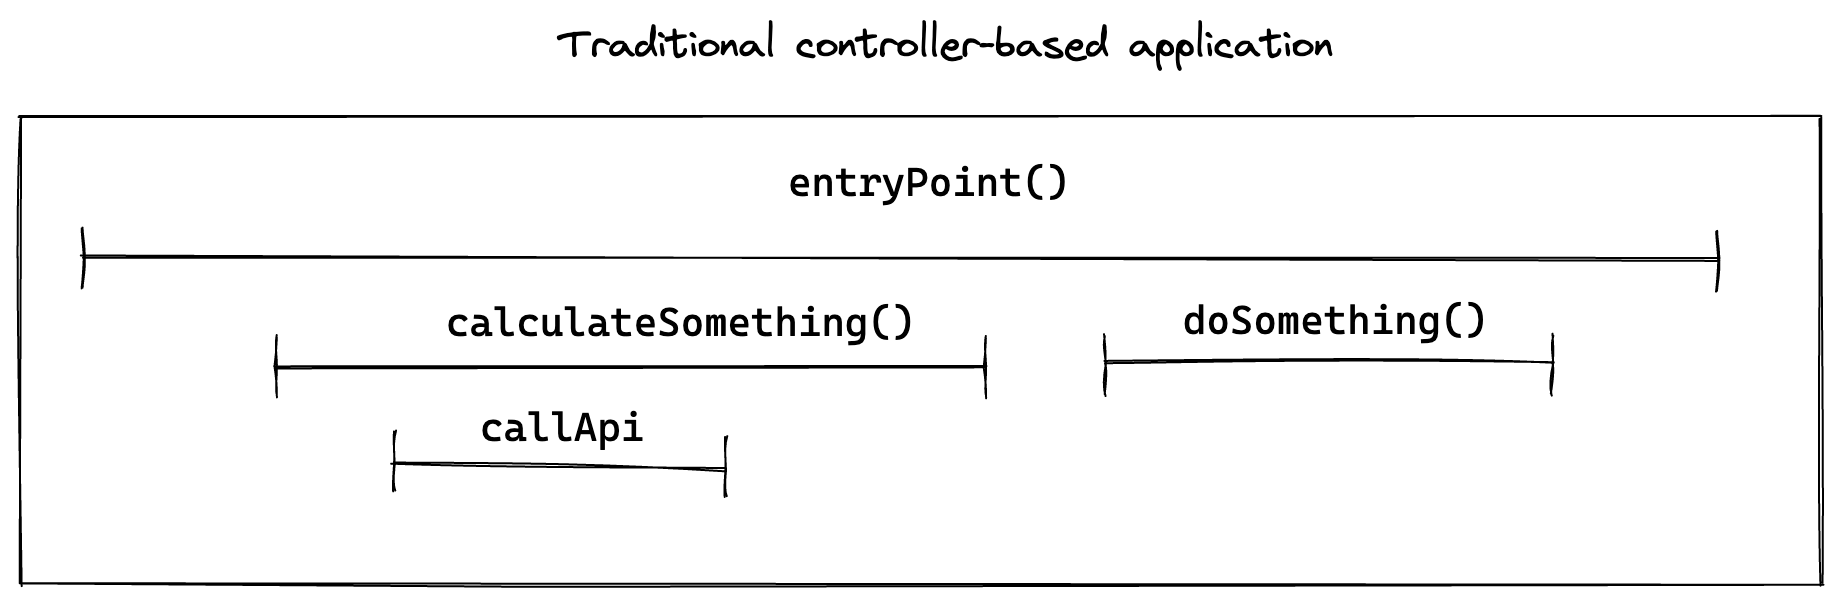
Now, if you have a normal HTTP request/response-based application, it is easy to figure out where to start and end your root spans. All your incoming requests will most likely be handled by a controller and each endpoint will be handled by a method. In this type of application, your root span can be started once the request hits the application in the method in your controller and ends before you send the response.
During the lifetime of that request, you can create child spans to track other works done while processing the request. There's only one entry point for requests and exiting the entry point means the request is finished. If your application encountered errors during the execution, it can set the span status to ERROR and add the stack trace info to the span.
Conclusion
Once you managed to create spans, set attributes, and then export it to a backend. You're pretty much done with the basics of instrumenting your application. Go ahead and add more traces to your application!