Instrumenting CI Pipelines using otel-cli
Why?
Why not? Get the whole picture of what is happening in your pipeline. Get notified when something is taking longer than it should.
How?
Use otel-cli, a standalone Go binary that can create OpenTelemetry traces and sends to a tracing backend using the OTLP protocol.
OpenTelemetry?
Tracing Backend?
You collect traces from your application using the OpenTelemetry SDK. To visualize the relationship between the traces, you'll have to send the traces to a tracing backend, which will provide a UI for exploring your traces. Example of tracing backend:
Self-hosted:
- Grafana Tempo
- Jaeger
- ElasticSearch
Paid:
- Honeycomb
- Datadog
- Grafana Cloud
- ElasticSearch Cloud
OTLP Protocol
The OpenTelemetry Protocol (OTLP) specification describes the encoding, transport, and delivery mechanism of telemetry data between telemetry sources, intermediate nodes such as collectors and telemetry backends.
https://opentelemetry.io/docs/reference/specification/protocol/otlp/
otel-cli?
OpenTelemetry (OTel) supports many SDK to create traces from your application but in CI pipelines, you're usually using a shell script language like Bash which is not supported by any OTel SDKs currently. Therefore, we need a tool create this traces for us.
otel-cli is a tool that will do that. It will generate a trace ID, span ID, and sends the traces in the expected format.
How to use otel-cli?
The simplest way to start using it is first to set the OTEL_EXPORTER_OTLP_ENDPOINT value to tell otel-cli which backend to send our traces to.
Starting a local tracing backend server
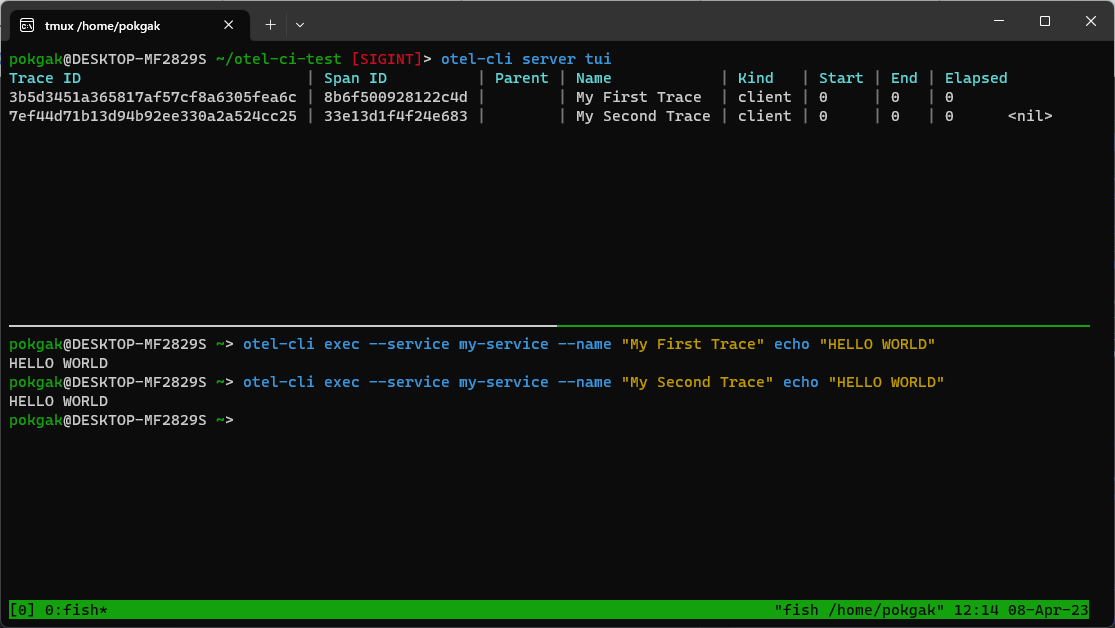
otel-cli has a server subcommand that you can use to run a simple tracing backend on your local. You can run the following command in another terminatl to start the server:
otel-cli server tuiSetting the tracing backend endpoint
Now that we have a server running locally to send our traces to, let's tell otel-cli to send all the traces that it generated to this local server:
export OTEL_EXPORTER_OTLP_ENDPOINT=localhost:4317Here we send it to localhost on port 4317. Port 4317 is the default port when sending traces using grpc.
Sending our first trace
You can use exec subcommand to wrap a command with otel-cli. It will automatically set the start and end time to calculate the run duration for the command:
otel-cli exec --service my-service --name "My First Trace" echo "HELLO WORLD"Then you should be able to see the a new line in the other terminal that we ran otel-cli server tui just now.
Conclusion
In this article, I showed you the simplest way you can use otel-cli. To get more valuable information from your traces, you'll usually need to add nested spans to your trace. It'll help break down the execution of your program to more smaller unit that can be inspected. To get more advanced example, you should refer to the otel-cli examples.